#work #kubernetes #disaster
A persistent volume disaster
Published May 21, 2021 by Francesco

OKD logo.
DISCLAIMER
I’m not a K8s & GlusterFS expert so probably someone better than me would’ve solved this in 5 minutes, but still this generated enough wtf to me and the team I’m in to make me write about the whole experience.
Intro
At work I’ve inherited an on-premise installation of OKD 3.11 that is used a shared platform hosting for various groups, it is composed like this:
- 6 nodes total
- all nodes are workers
- 3 nodes do also master/infra
- permanent storage is based on containerized GlusterFs running on all nodes + Heketi
- heketi (the interface between k8s and gluster) has the storage on the gluster installation itself
I know it isn’t the best recommended installation, but also there was no allocated time/budget to improve it.
Operating/maintaining the cluster is not my primary focus, but nonetheless being one of the few with enough knowledge to do so I’m also tasked with maintenance and giving support to the teams using it.
Most of the time is just checking grafana and pods that might be stuck, but sometimes something bad happened and I need to recover the situation.
This is the story of the biggest disaster that happened (so far).
Friday
Late in the evening I get an alert from the cluster monitoring about a pod of GlusterFS not having space anymore: I start checking and after a df run inside the container it confirms me that the root fs is full.
I suppose this is about something not being released from the fs, as some notes of the previous ops manging this confirms and I proceed to apply a standard fix: quarantining the node, restarting the gluster container, waiting for the completion of the GlusterFS startup script that does pvscan, and confirming that is happily up&running.
Everything is fine and I logoff for the weekend.
Weekend
I do not work on the weekend, but Gluster do so and it was preparing a surprise for me on Monday.
Monday
I’ve some emails from users and some alerts, not a good way to start the week: it seems that some applications have trouble mounting their persistent volumes in the containers.
Checking the logs of the container restarted on friday and I see this:
[2021-02-01 02:41:30.695758] W [glusterd-locks.c:845:glusterd_mgmt_v3_unlock] (-->/usr/lib64/glusterfs/4.1.7/xlator/mgmt/glusterd.so(+0x2431a) [0x7fce6671a31a] -->/usr/lib64/glusterfs/4.1.7/xlator/mgmt/glusterd.so(+0x2e550) [0x7fce66724550] -->/usr/lib64/glusterfs/4.1.7/xlator/mgmt/glusterd.so(+0xe86b3) [0x7fce667de6b3] ) 0-management: Lock for vol vol_1ecc01efcb8a6ea69acf35cbd7071da0 not held
[2021-02-01 02:41:30.695764] W [MSGID: 106117] [glusterd-handler.c:6407:__glusterd_peer_rpc_notify] 0-management: Lock not released for vol_1ecc01efcb8a6ea69acf35cbd7071da0
[2021-02-01 02:41:48.493005] W [glusterd-locks.c:845:glusterd_mgmt_v3_unlock] (-->/usr/lib64/glusterfs/4.1.7/xlator/mgmt/glusterd.so(+0x2431a) [0x7fce6671a31a] -->/usr/lib64/glusterfs/4.1.7/xlator/mgmt/glusterd.so(+0x2e550) [0x7fce66724550] -->/usr/lib64/glusterfs/4.1.7/xlator/mgmt/glusterd.so(+0xe86b3) [0x7fce667de6b3] ) 0-management: Lock for vol vol_1ecc01efcb8a6ea69acf35cbd7071da0 not held
[2021-02-01 02:41:48.493012] W [MSGID: 106117] [glusterd-handler.c:6407:__glusterd_peer_rpc_notify] 0-management: Lock not released for vol_1ecc01efcb8a6ea69acf35cbd7071da0
[2021-02-01 02:41:57.646686] W [glusterd-locks.c:845:glusterd_mgmt_v3_unlock] (-->/usr/lib64/glusterfs/4.1.7/xlator/mgmt/glusterd.so(+0x2431a) [0x7fce6671a31a] -->/usr/lib64/glusterfs/4.1.7/xlator/mgmt/glusterd.so(+0x2e550) [0x7fce66724550] -->/usr/lib64/glusterfs/4.1.7/xlator/mgmt/glusterd.so(+0xe86b3) [0x7fce667de6b3] ) 0-management: Lock for vol vol_1ecc01efcb8a6ea69acf35cbd7071da0 not held
[2021-02-01 02:41:57.646703] W [MSGID: 106117] [glusterd-handler.c:6407:__glusterd_peer_rpc_notify] 0-management: Lock not released for vol_1ecc01efcb8a6ea69acf35cbd7071da0
It seems genuinely bad, but most of the consensus on the net is that it can happens and usually a restart fix it, so I unschedule the whole node from the Kubernetes cluster and proceed to a reboot.
… wait … wait …
Sh*t the bad lines in the log are still there, so before continuing and given the cluster is used also for production workloads I call a meeting with my supervisor and the team to update them about the issue in detail.
A brief meeting later we decide to unschedule the node from the cluster and disable GlusterFS on it, some volumes will have 2 replicas instead of 3 but applications will run and we get extra time to find out the root cause of the issue.
I do it, everything seems everything is fine so we logoff and update to tomorrow morning.
Tuesday
THE LINES ARE BACK
IN A NEW NODE

Now the cluster serves some of the disk in read-only mode (the replica factor was 3) this means that some production workload are having again issues, we need to provide a rapid workaround: let’s create new volumes on the remaining nodes and copy the data there, when everything is fixed we’ll delete the old ones.
Everyone agrees to this, is straightforward and easy doable, so I proceed.
IT DOESN’T WORK
Volumes were created (sometimes) but we had trouble mounting them, it seems like that you can now mount a volume only from a node, the others are refusing also the basic operations, like opening the gluster cli.
New troubleshooting session: network is up, transfer between nodes and/or pods is fine, dns is fine etc…
On two nodes (the ones with the crazy log lines) no bricks are being exposed (a type of gluster process do it per brick), and the gluster cli works only on the node that is also able to mount volumes.
It’s meeting time to announce that the apocalypse has come and it has taken our cluster: we discuss a way to move production workloads away from the cluster because sooner or later we will need to do some actions that will impact the uptime of the production deployments.
We inform the organization of the problems and the mitigation we’re gonna apply the next day for production workloads that uses persistent volumes: moving to one node cluster with local fs as storage recovered from the backups and/or read from the mounted gluster volumes.
Wednesday
While applying the mitigation we engage with the vendor that maintains our VmWare infra and the basic patching of every VM: we don’t have a contract for this specifically but we ask anyway if they have some GlusterFS specialist and also a senior K8s person to review the whole mess.
We get a positive answer but they will be available only from the next day, so we focus on the production workload mitigation and grabbing as much data as possible to help the specialists debug this.
Thursday
We start collaborating with our vendor and it’s not off to a great start: “Although we keep a couple of GlusterFS installation we’re phasing it out for issues like this”
Great!
They start grabbing data from every source possible and try to analyze it to get to the root of the issue, while the rest of the team continue the mitigation for production workloads.
Friday
The vendor asks to perform some actions that might be disruptive, but since all the production has been moved up we agree to it.
The actions includes: rebooting, touching glusterfs files, touching networking etcetera.
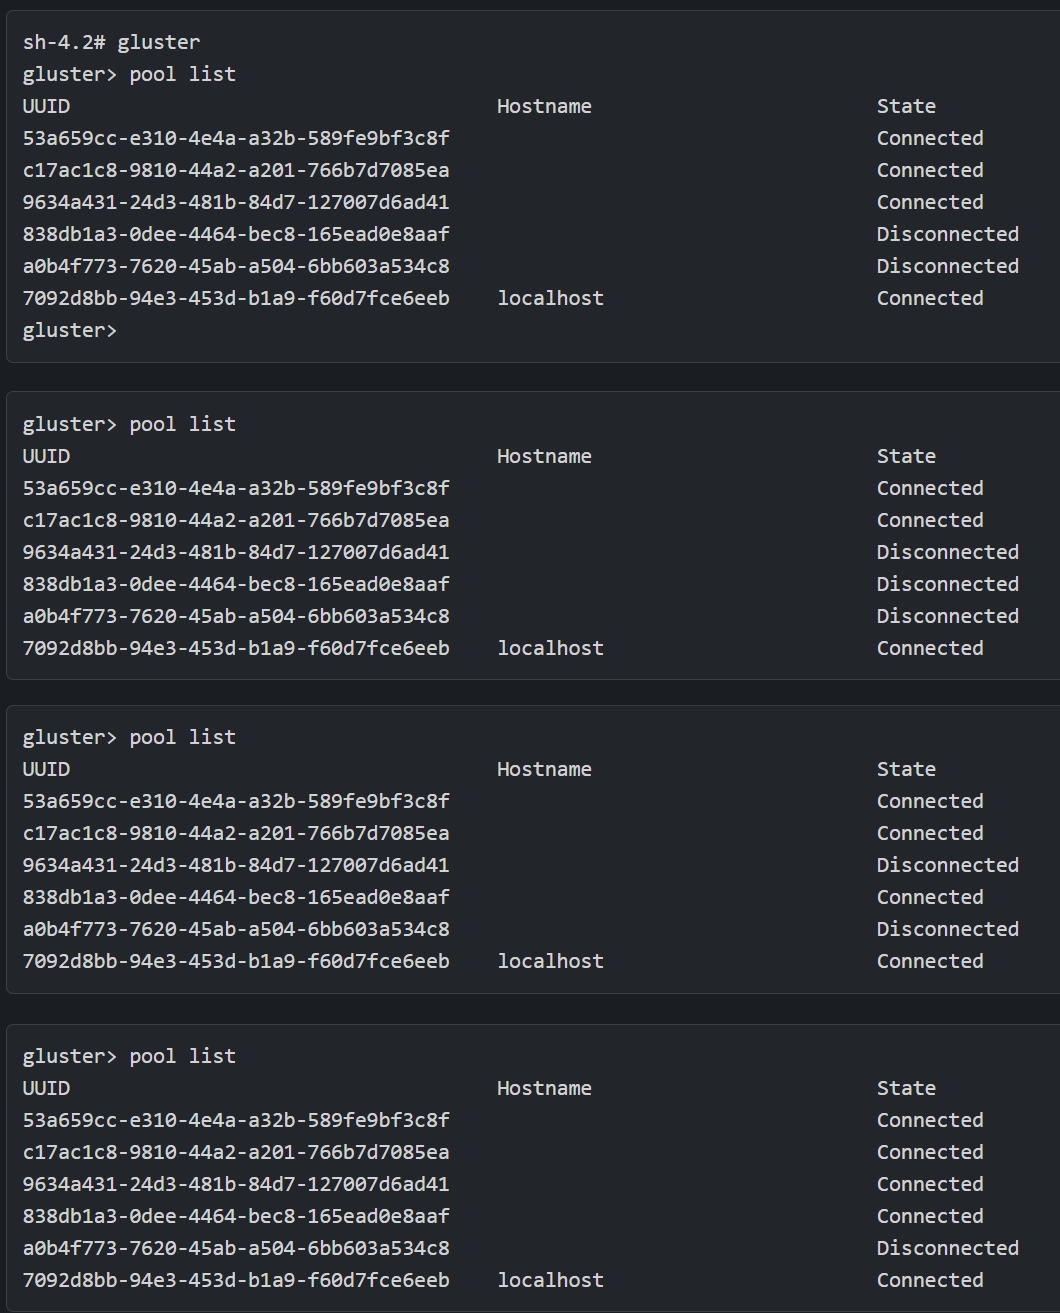
We get a new symptom, what I’d like to call the connection dance:

The whole people looking at this (me included) are now thinking that Skynet exists and is fucking with us.
We do a final reboot of the dancing nodes, and adjourn to monday.
Monday
It seems that the dancing nodes are back to exposing bricks ( YAY \o/ ), but this means that it took like 2 days for the bricks to come online… it is strange.
I check the logs and still get the locks error, so after searching for the available node of the day in the gluster cluster I proceed to query how many volumes are being served:
~5500
Wait… we have, in Kubernetes, only ~100 claims so how is this possible? It seems that volumes are not always deleted and a possible cause could be this (we’re still not sure about this but this seems one valid explanation).
We try also to ask around to the creators of old posts in the gluster newsgroup with similar problems to ours if they managed to recover, but with no luck:

So it’s time for plan B:
- install the latest stable GlusterFs on 3 new VMs (*)
- install the latest stable Heketi
- update the Gluster cli/libs on OKD nodes
- add a new pv class definition pointing to the new Heketi
- test the hell out of it
- script an automated sync from backup to the new gluster with volume recreation for all namespaces/projects
- prepare a procedure to sync the data for the migrated production workloads
- remove the old gluster volumes
- add a shitload of monitoring to new GlusterFS installation
(*) why Gluster again? In Kube 1.11 (CSI 0.3 I think) there were not much stable CSI plugins aside from Gluster
Tuesday
The plan is flawlessly executed till this point:
- remove the old gluster volumes
The old Heketi is down because the old Gluster is down (it stored the data on Gluster itself) so when now we ask K8s to delete a volume it doesn’t do it because the APIs that Heketi should expose are not present.

It’s very late and horrors in the dark are scarier, so I decide to think about this the next day.
Wednesday
Since we’re not able to recover the old Heketi functionalities, I look at the Heketi documentation about it’s API and it’s like I need to mock the DELETE volume endpoint and another one, so I fire up VsCode, put down 20 lines in node.js and replace the old Heketi with FakeHeketi 1.0 and trigger the volume deletion:
IT WORKS \o/
All the volumes are removed and I can remove also the pv class.
I do more testing and then schedule the production workloads to be moved back with the various application owners to be done in the next days.
The End (?)
In the following days production workloads were migrated and order was restored in the galaxy.
It was a very instructive experience about unknown failure modes, selecting a tech in which the teams have low knowledge of (GlusterFS), the lack of post-facto training on the same specific technology even after years from the installation: this gotchas were baked in the plan for the upgrade to the new 4.x version.
Also it was eye opening that postponing the cluster updates to the latest kubernetes/okd stable has probably created extra troubles: with a modern CSI driver (maybe) this mess would’ve been easier to debug/fix and with a more modern kube version more help could’ve been in the KBs/communities around the world.
Later, as a cherry on the top, we’ve also found a bug in our version of OKD that has been fixed very very later that make gluster mounts the volume always from the first node in alphabetical order ( meh ): we’ve decided to do not the upgrade because of we just have such few volumes being used and the upgrade is planned to be executed soon.
That’s all!
Message me on Twitter if you’ve any comment!
© 2026, Francesco Furiani | Jekyll theme.